
In earlier explorations, we identified the GenAI models that appeared most promising for data visualisation tasks—models that demonstrated strong code generation capabilities, basic support for data wrangling, and compatibility with popular Python libraries such as Matplotlib and Seaborn. In this follow-up case study, we examine a different dimension: rather than focusing on which models perform best, we investigate the current limitations of a diverse set of GenAI models when producing a simple, visually guided bar chart from a structured dataset.
Input file
The dataset used in this analysis was sourced from Kaggle and includes detailed information on Nobel Prize winners from 1901 to 2016. It contains variables such as name, gender, birth country, award category, and year of recognition. (For an overview of the data cleaning and preprocessing steps, see this related blog post.)
Prompt
The prompt focused on producing a simple bar chart based on a structured dataset, with specific visual styling requirements (e.g. reversed flare palette, sorted bars, gridlines). It did not describe the dataset schema or column names — the model was expected to infer relevant fields (such as gender and category) directly from the uploaded file. This allowed us to assess not only code generation, but also the model's ability to interpret data structure and follow visual formatting constraints.
Load the dataset from the file nobel_prize_by_winner_utf8.csv.
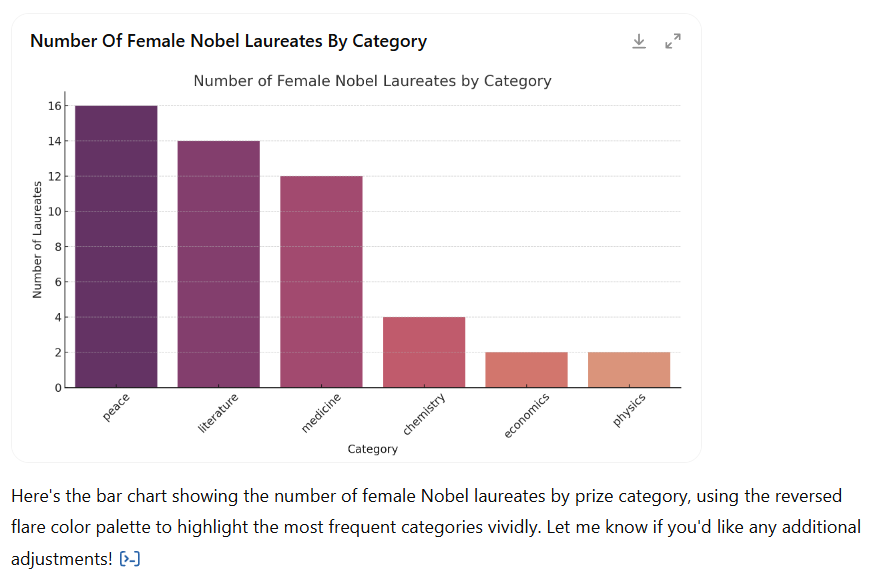
Using this data, create a bar chart showing the number of female Nobel laureates per prize category.
Apply the flare colour palette, reversed so that the most frequent categories appear in the darkest shades. Ensure that the colours are vivid enough to be clearly visible on a white background (avoid very pale tones).
Sort the bars in descending order by number of laureates.
The chart should include the following:
- Title: “Number of Female Nobel Laureates by Category”
- X-axis label: “Category”
- Y-axis label: “Number of Laureates”
X-axis labels rotated for clarity.
Gridlines along the Y-axis for readability.
Output
Mistral Le Chat
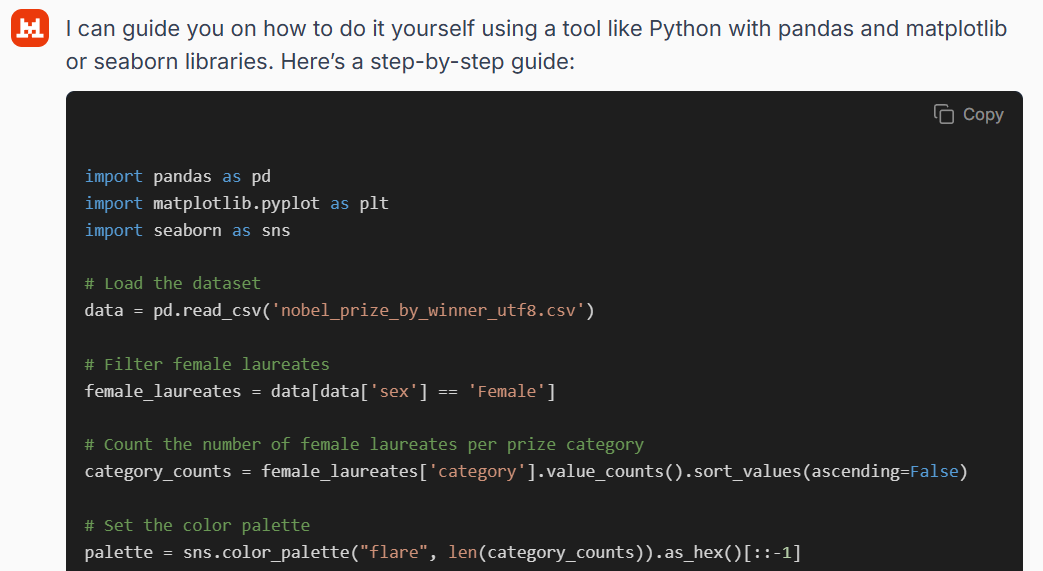
Mistral is unable to generate visual output directly, and instead responded by providing Python code intended to reproduce the requested plot. However, the code it produced was ultimately non-functional. The most critical error was its reliance on a non-existent "sex" column to identify female laureates. The correct column in the dataset is "gender", meaning the model's filtering condition would cause the code to fail on execution. This basic schema mismatch indicates a lack of understanding of the data structure, despite the apparent fluency of the response.
The model also mishandled the colour palette. While it correctly selected the flare palette and attempted to reverse the order of colours, the implementation used a method that may be incompatible with standard plotting functions and does not guarantee proper visual output. Beyond that, several stylistic elements requested in the prompt — such as gridlines, axis labels, and label rotation — were included in the code. Still, since the initial filtering step fails, the resulting chart cannot be rendered without manual correction. Overall, the response gave the impression of competence, but failed on basic schema understanding and detailed execution.
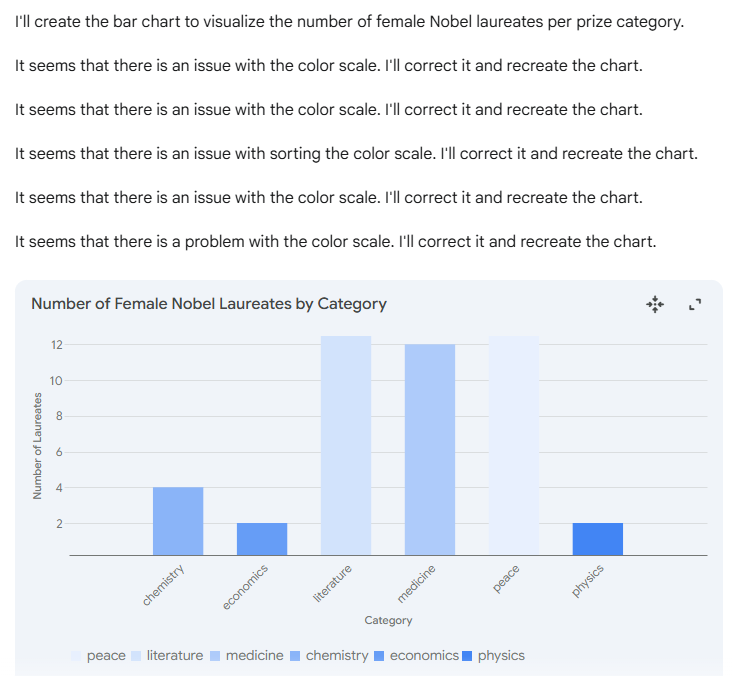
Gemini 2.0 Flash
Gemini 2.0 Flash could render a chart, but its response highlighted persistent instability and superficial handling of visualisation tasks. Upon receiving the prompt, the model attempted to create the correct bar chart, yet became trapped in a repetitive loop, continuously reporting and trying to correct a vague “issue with the color scale.” This behaviour resulted in five identical messages and a final visualisation that failed to meet key requirements of the prompt. The resulting chart displayed the correct title and axis labels, but fell short on several other fronts. The bars were not sorted in descending order by the number of laureates, and the colour scale—which should have reflected the reversed flare palette—instead defaulted to a set of generic blue tones. Furthermore, the visual design lacked contrast, and the legend was left visible despite explicit instructions to remove it.
These limitations are consistent with earlier findings. In a previous analysis, we examined Gemini 2.0 Flash’s performance in greater detail, and we found that it struggled with even basic bar chart construction when specific styling instructions were provided (see full post).
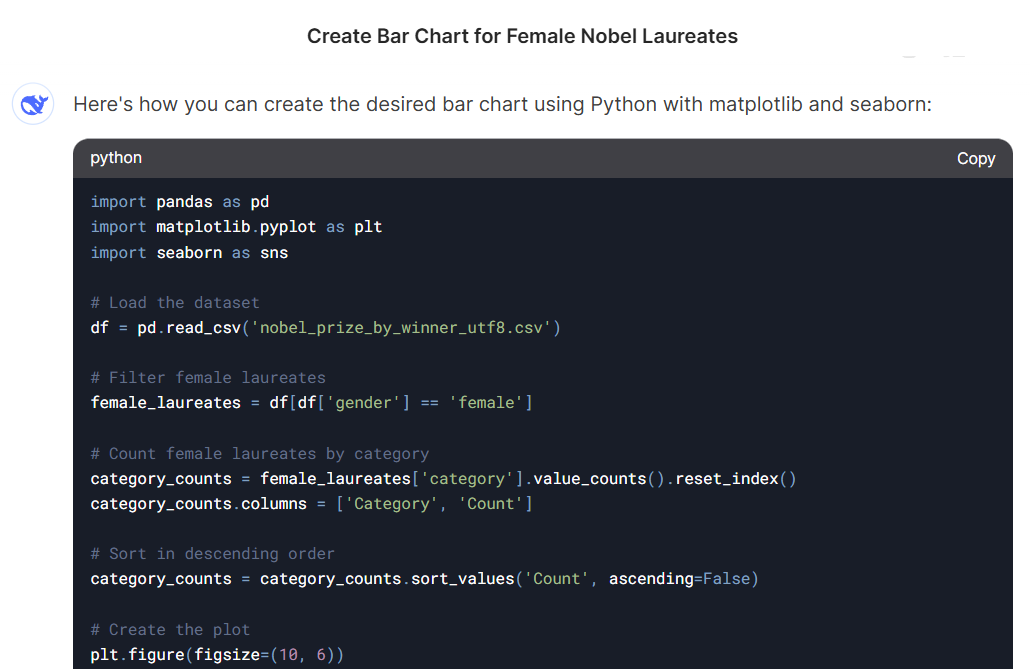
DeepSeek-V3
DeepSeek-V3 could not access or parse the uploaded CSV file and returned an error message indicating that file processing may violate its platform policies.

Despite this, the model generated Python code for the requested visualisation task. The code correctly used the "gender" column to filter female laureates, which allowed it to run without errors—unlike Mistral, which referred to a non-existent "sex" column. However, since DeepSeek could not read the file, this choice was likely coincidental rather than evidence of schema awareness. The code ran smoothly and fulfilled all aspects of the prompt, including sorting, layout, and styling requirements. It applied the reversed flare palette with appropriate colour adjustments and produced a clear, well-formatted chart without manual correction.
Grok-3, Copilot and Qwen2.5-Max
Grok-3, Copilot, and Qwen2.5-Max were unable to generate visual output directly via the interface, but each returned Python code intended to produce the requested chart. Notably, all three models correctly identified the "gender" column for filtering female laureates—avoiding the schema errors seen in other responses—and the code they produced ran without any need for manual correction.
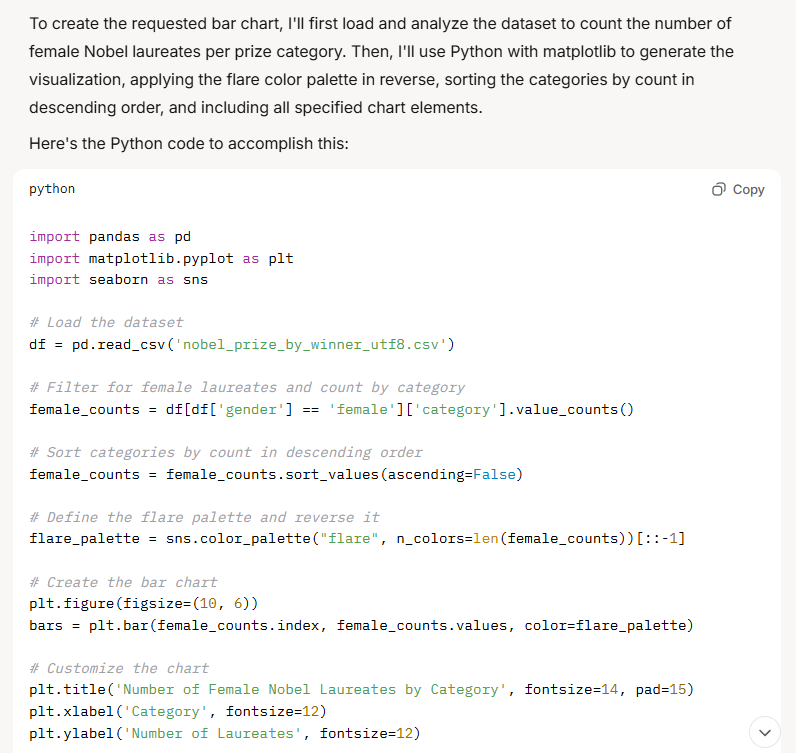
When executed, the scripts produced the desired bar chart in line with the prompt’s requirements. However, this outcome assumes a user with basic programming skills, as the models did not render the chart themselves. While the solutions were technically sound, their practical usefulness remains limited for non-coding users.
Claude 3.7 Sonnet, GPT-4o and GPT-4.5
Claude 3.7 Sonnet, GPT-4o, and GPT-4.5 once again confirmed the stability we observed in earlier testing (see detailed evaluation). All three models successfully generated the bar chart directly within the interface, following the prompt’s instructions with a high degree of visual accuracy. They effectively applied the reversed flare palette, sorted the bars correctly, and included all essential layout elements such as titles, axis labels, and rotated X-axis text. Unlike most other models, no manual execution or debugging was required, making these models particularly well-suited for users seeking a complete, no-code visualisation workflow.
Model comparison
| Model | Direct Visual Output | Prompt Fully Followed | No-Code Friendly |
|---|---|---|---|
| GPT-4.5 | ✅ Yes | ✅ Fully | ✅ Yes |
| GPT-4o | ✅ Yes | ✅ Fully | ✅ Yes |
| Claude 3.7 | ✅ Yes | ✅ Fully | ✅ Yes |
| Copilot | ❌ No (code only) | ✅ Yes (via code) | ⚠️ Limited |
| Grok-3 | ❌ No (code only) | ✅ Yes (via code) | ⚠️ Limited |
| Qwen2.5-Max | ❌ No (code only) | ✅ Yes (via code) | ⚠️ Limited |
| DeepSeek-V3 | ❌ No (code only) | ✅ Yes (via code) | ⚠️ Limited |
| Gemini 2.0 Flash | ✅ Partial | ❌ Incomplete | ❌ No |
| Mistral | ❌ No (code failed) | ❌ Code broken | ❌ No |
Recommendation
This case study reveals a clear divide between GenAI models that can generate code for visualisations and those that can produce polished outputs autonomously. While many models were able to generate functional Python scripts, only a handful — notably GPT-4.5, GPT-4o, Claude 3.7 Sonnet — succeeded in rendering the chart directly within the interface, adhering closely to the prompt’s layout and styling requirements.
For users with no coding experience, these models offer the most accessible and reliable solution for visual tasks. By contrast, models such as Grok-3, Copilot, Qwen2.5-Max, and DeepSeek-V3 performed well in code generation, producing functional scripts that followed the prompt — but still required manual execution, which limits their usefulness for non-technical users. Mistral and Gemini 2.0 Flash, meanwhile, struggled with core aspects of the task, either generating broken code or producing incomplete and unstable visual outputs.
The authors used GPT-4.5 [OpenAI (2025) GPT-4.5 (accessed on 14 April 2025), Large language model (LLM), available at: https://openai.com] to generate the output.