
In this case study, we demonstrate how generative AI can be used to carry out a full data pre-processing and descriptive analysis workflow on the Nobel Prize dataset. Our objective was to prepare and explore the data in a methodologically sound manner—converting numerical types, handling missing values, verifying completeness, and producing targeted summary statistics—following the same sequence and logic one would apply in a typical code-based data analysis workflow.
While many generative AI models excel at text-based data tasks, their ability to handle and visually render charts remains limited or inconsistent across platforms. For this reason, we recommend using GPT-4o, OpenAI’s multimodal model, which successfully executed each stage of the data workflow—including visualisation—through natural language prompts. This approach closely follows what one would ordinarily do in Python or R, yet demonstrates that such workflows can now be executed interactively and flexibly via GenAI—making it a practical alternative for researchers engaged in exploratory analysis.
Input file
The dataset used in this analysis was sourced from Kaggle and includes detailed information on Nobel Prize winners from 1901 to 2016. It contains variables such as name, gender, birth country, award category, and the year of recognition. The data was downloaded in CSV format and was the basis for all pre-processing and analysis steps presented in this blog.
Prompt 1 - Load and preview the data
Load the CSV file nobel_prize_by_winner_utf8.csv and show me the first 10 rows to get an overview of the data structure.
This step allowed us to inspect the layout of the dataset, confirm the presence of key variables such as year, share, gender, and bornCountry, and verify that the file had loaded correctly.
Output 1
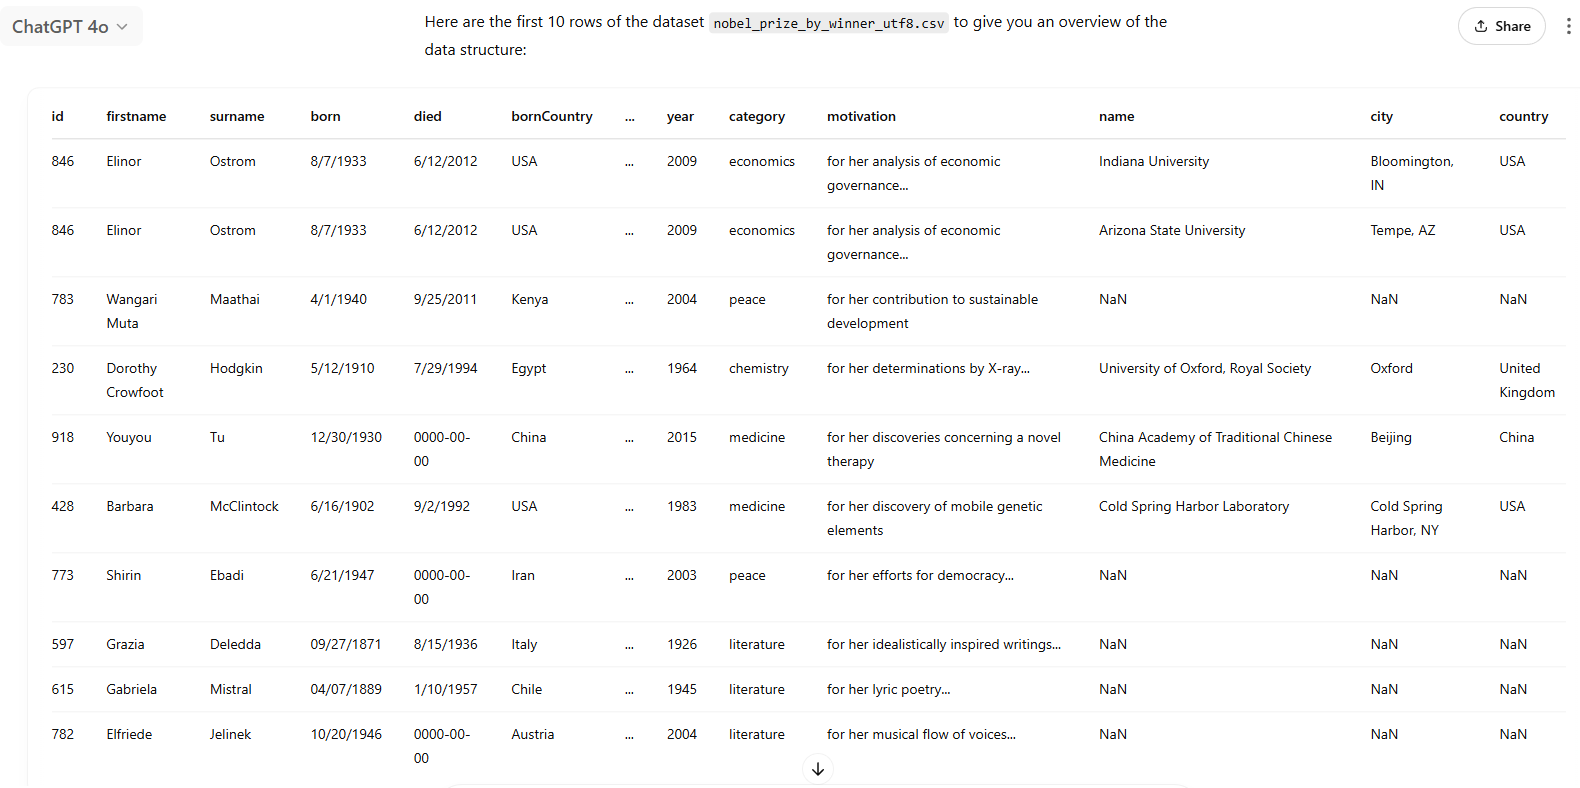
The model performed the task accurately and returned a well-structured dataset overview. At the same time, the preview made it evident that data cleaning would be essential before proceeding, as the dataset included both duplicate IDs and various representations of missing values. These observations directly informed the design of the subsequent cleaning steps.
Prompt 2 - Convert numerical columns to integers
Convert the year and share columns to integers to remove decimal points. Make sure that missing values are handled gracefully and that no data is lost.
Output 2
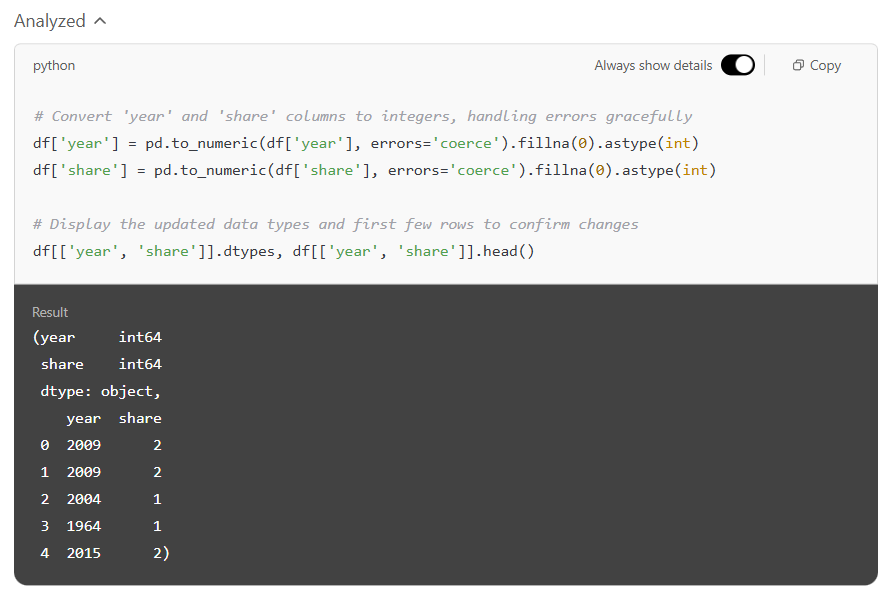
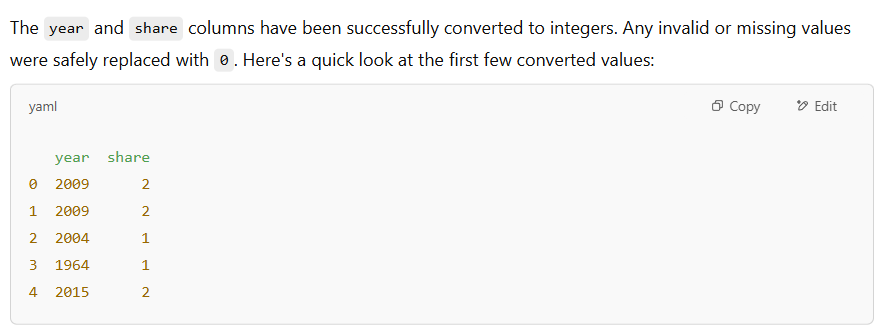
In the second step, we asked the model to remove unnecessary decimal points from the year and share columns by converting them into whole numbers. The model handled this smoothly: it ensured that any problematic or missing entries were treated safely and returned clean, easy-to-read values across the board. The updated columns displayed years like 2009 instead of 2009.0, making interpreting the data more natural.
Prompt 3 - Generate descriptive statistics and check for missing values
Display descriptive statistics for all columns, including non-numeric ones. Then show the number of missing values in each column.
This prompt gave us a broad overview of the dataset and allowed us to identify where values might be missing, incomplete, or misclassified.
Output 3
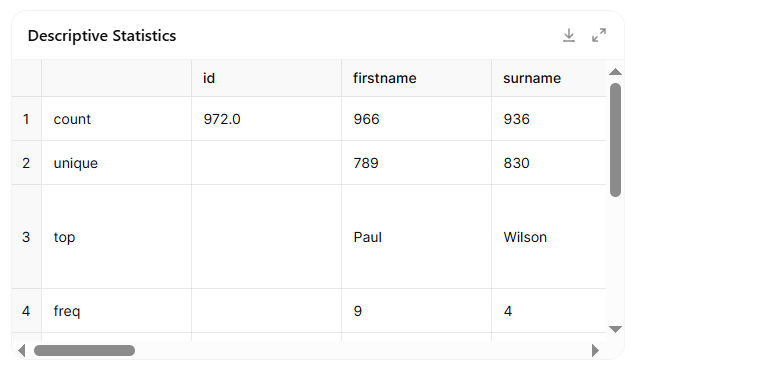
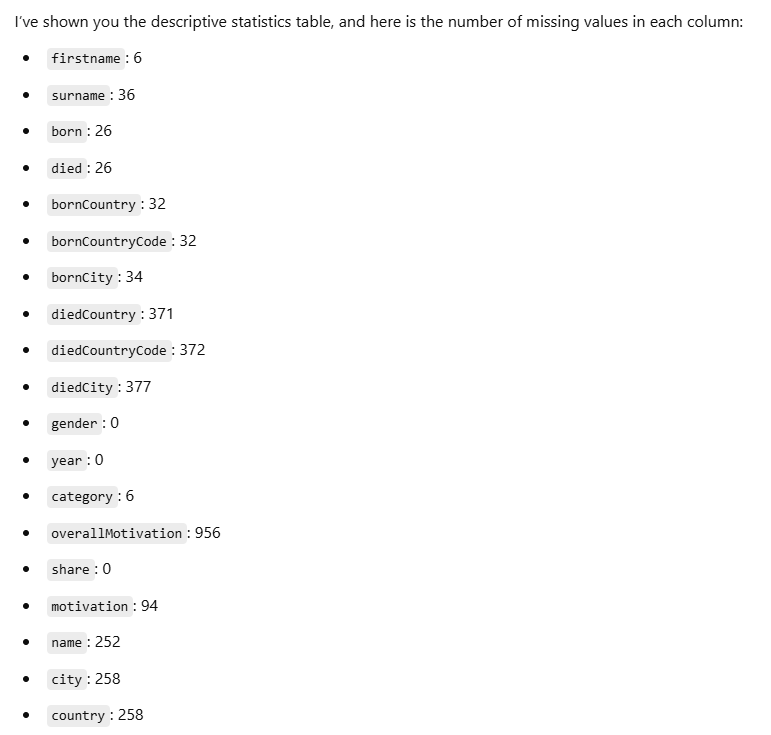
In the third step, the model generated a summary table with key descriptive statistics and provided a detailed overview of missing values in each column. This was an essential diagnostic phase, helping us understand the overall structure of the data. The summary included useful information such as the number of unique entries per field, the most frequent values (e.g. the most common first names), and basic numerical summaries like minimum, maximum, and average for relevant columns. Alongside this, the model also listed how many values were missing in each variable—highlighting, for instance, that hundreds of entries lacked information about death date or institution. This step was particularly valuable because it allowed us to identify which parts of the dataset were complete and which would need cleaning or special treatment before visualisation.
Prompt 4- Standardise missing values by replacing with 'NA'
Convert all values in the dataset to strings, and replace all missing or NaN values with the string 'NA'.
Output 4
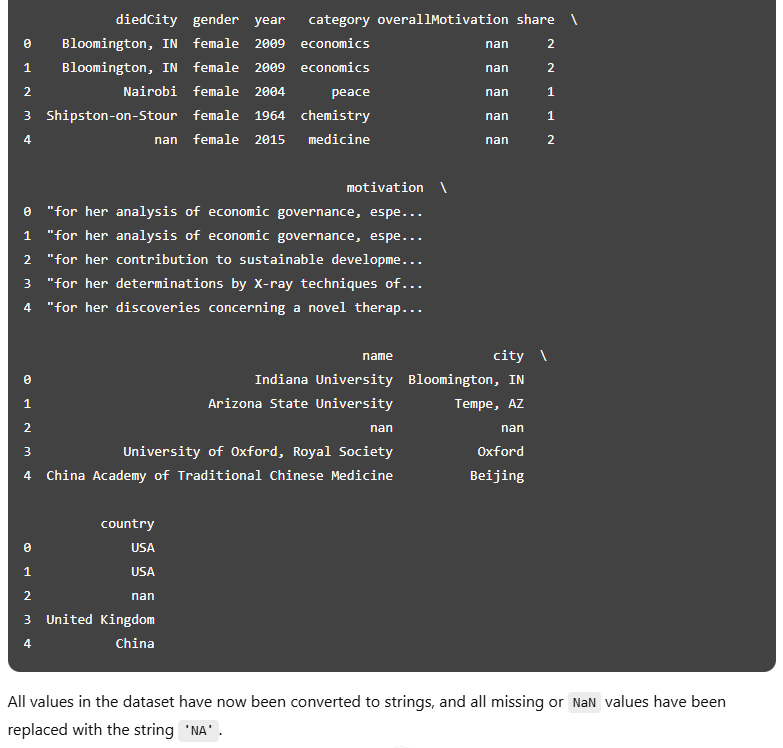
In this step, the model converted all values in the dataset to text and replaced any missing entries with the string 'NA'. This created a consistent and human-readable way of marking absent data, which is essential for keeping the dataset clean and avoiding confusion during further analysis. Rather than leaving gaps or relying on system-specific placeholders, the use of 'NA' made missing values explicit and easy to interpret. This approach also helped standardise the structure across all columns, ensuring nothing was accidentally overlooked — something we went on to verify in the following step.
Prompt 5 - Validate that no empty or missing cells remain
Check the entire dataset for any cells that are still missing (NaN), contain empty strings, or consist only of spaces. I want all such cells to be replaced with 'NA'.
Output 5
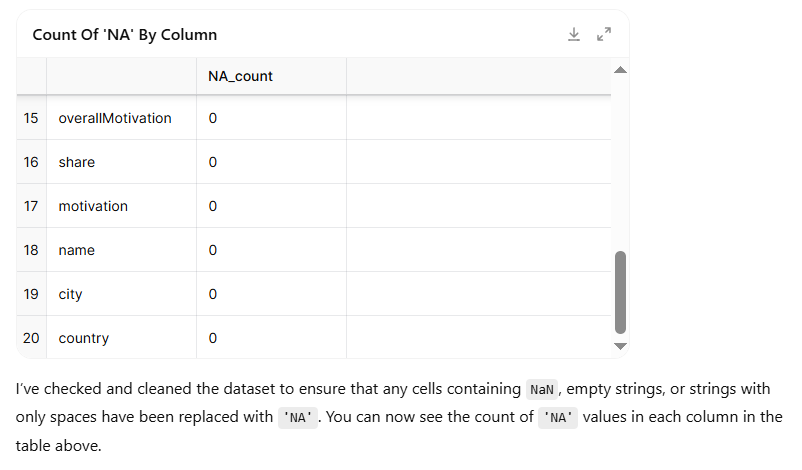
In this step, the model double-checked the dataset to ensure that all missing or blank entries had been correctly standardised. It looked not only for traditional missing values, but also for hidden gaps—such as empty strings or cells containing only spaces—and confirmed that these had all been replaced with 'NA'. The output table showed that each column now contained either valid information or clearly marked 'NA' values, with no inconsistencies remaining. This final validation confirmed that the dataset was fully cleaned and ready for analysis.
Prompt 6 - Produce statistics
Show a refined statistical summary: for numeric columns (excluding IDs), show count, mean, min, max, etc. For text columns, show the number of unique values and the most frequent value with its count.
Instead of indiscriminately generating summary metrics for all variables, this step produced targeted, interpretable statistics tailored to each data type.
Output 6
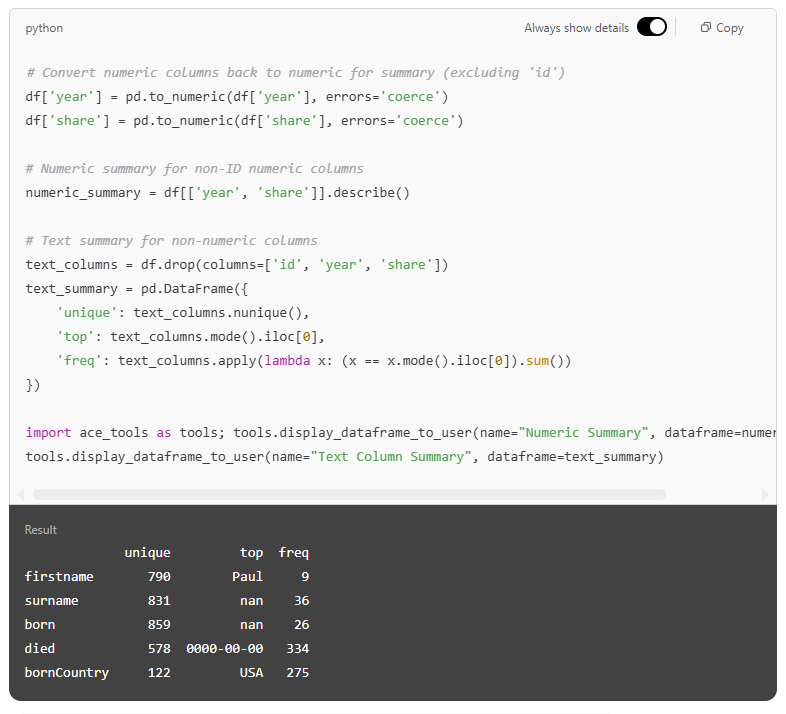
In this step, the model generated two clear summary tables to give a more focused dataset overview. The first table displayed key statistics for numeric columns, such as the minimum, maximum, and average values for year and share. The second table offered a summary of the text columns, highlighting how many unique entries each contained, the most common value (if available), and how frequently it occurred. This split between numerical and textual summaries helped simplify interpretation and ensured that each column was described in a way that matched its data type. The result was a highly readable snapshot of the dataset’s structure—informative, well-organised, and fully generated without manual coding.
Prompt 7 - Visualise top 10 countries of birth
Generate a horizontal bar chart showing the top 10 birth countries of Nobel laureates. Before plotting, exclude any rows where the birth country is missing ('NA', 'nan'). Use the 'virdis' seaborn colour palette, and apply a clean, grid-based style.
Output 7
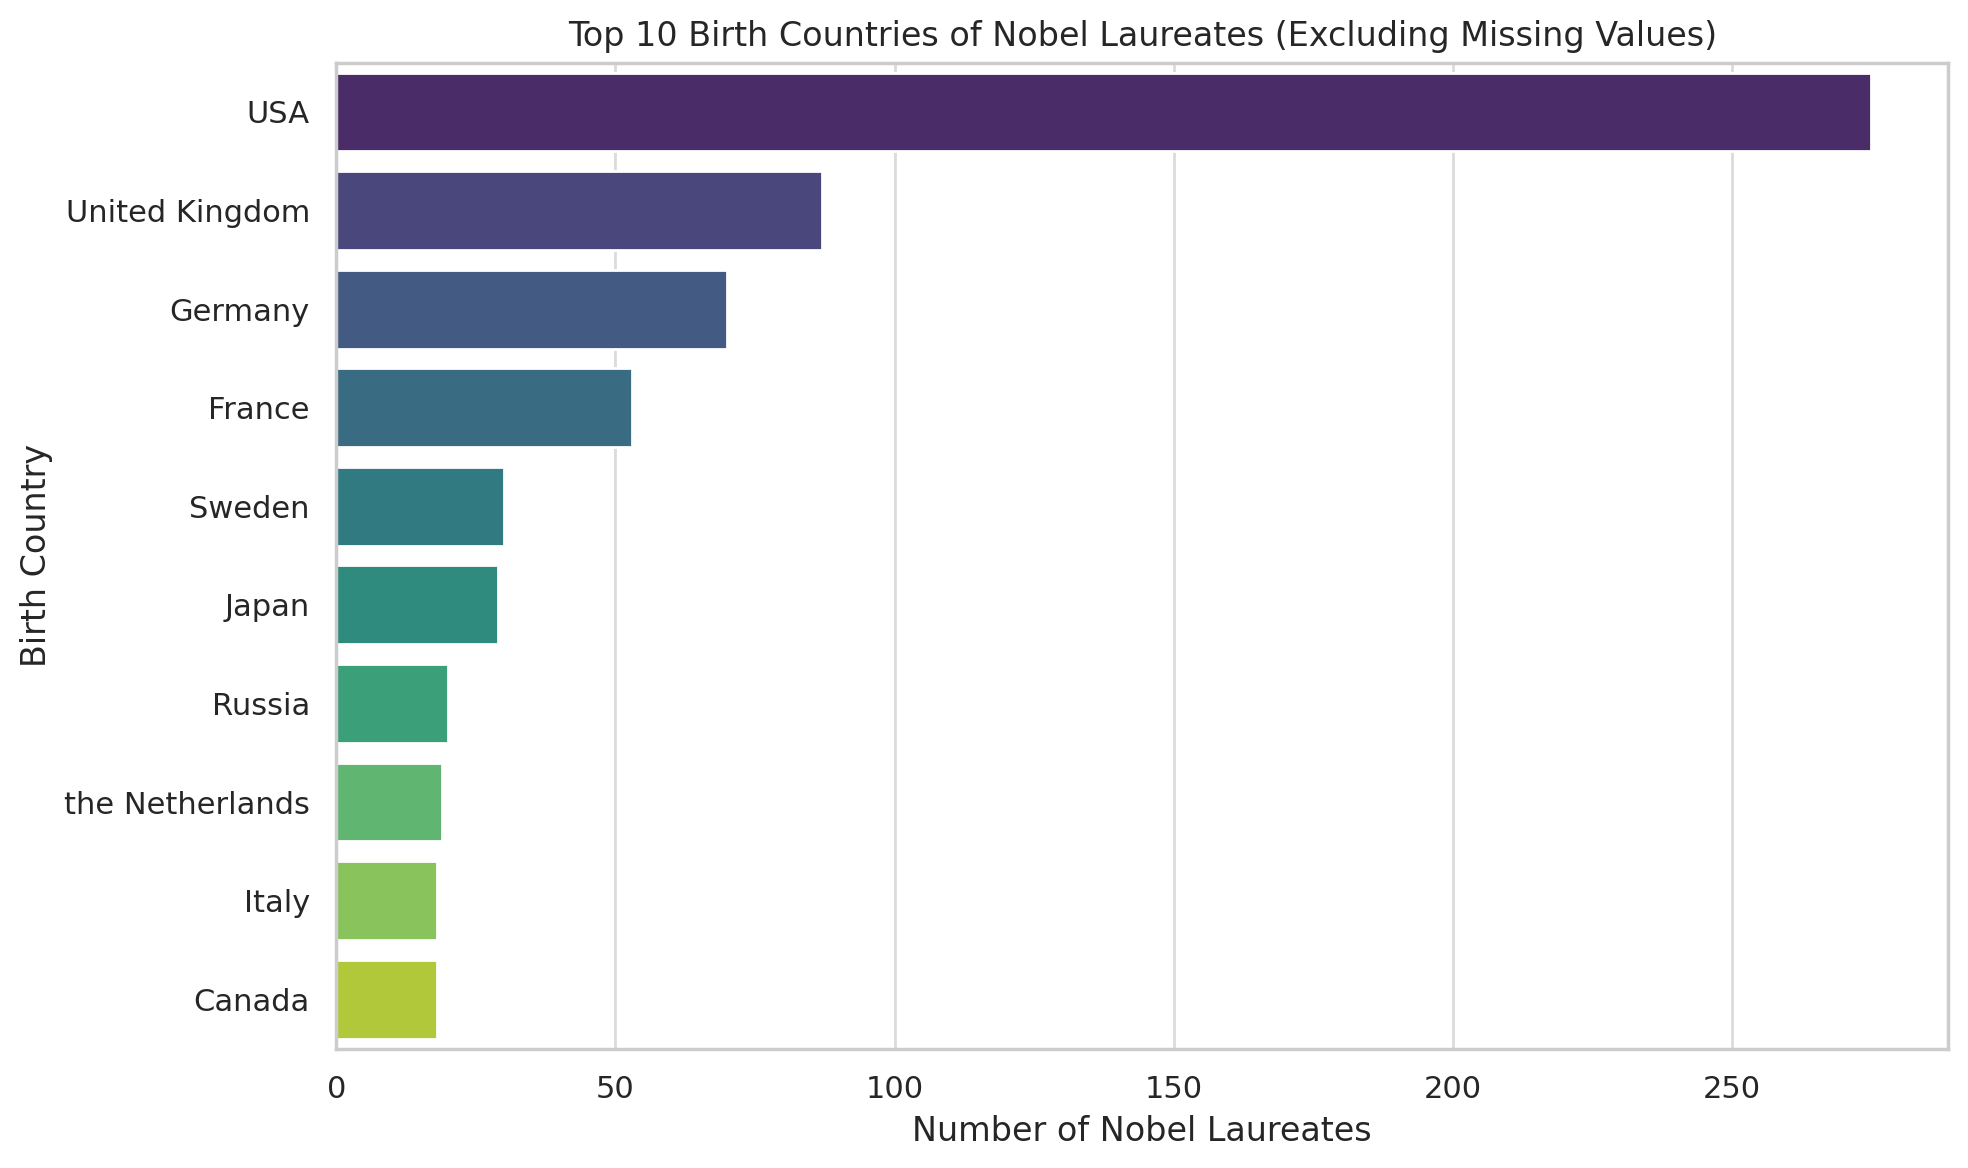
A clean and effective horizontal bar chart was generated to display the ten most common countries of birth among Nobel laureates. With the USA clearly leading, followed by the UK and Germany, the visual made key geographic patterns immediately apparent. By filtering out missing values ('NA'), the chart focused solely on valid country data, improving interpretability. A colour gradient and grid-based layout further enhanced readability. Such visualisations are particularly valuable in the early stages of analysis, as they help surface dominant trends that can inform more precise research questions and guide subsequent data exploration.
Prompt 8 - Visualise gender distribution
Create a pie chart showing the gender distribution of Nobel laureates, using blue for male and pink for female. Exclude organisations from this chart.
Output 8
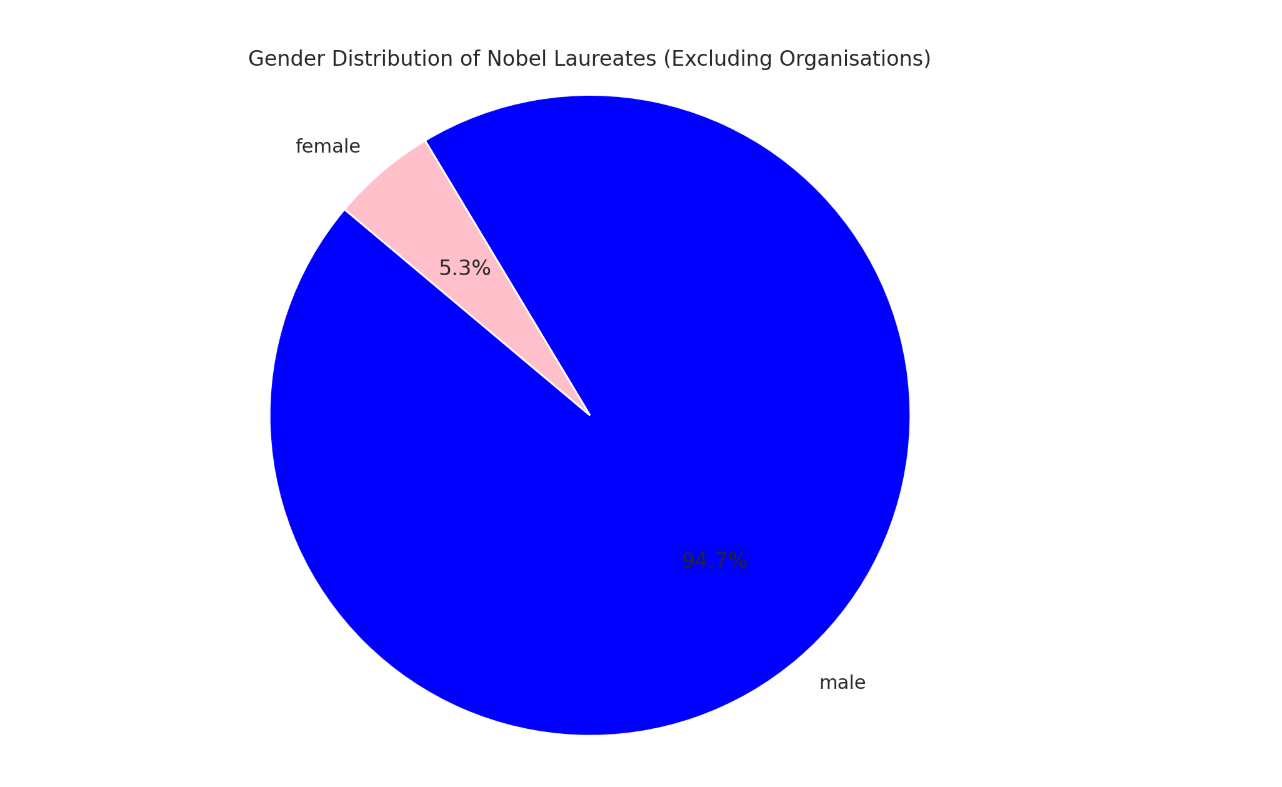
To conclude the visual exploration, we examined the gender distribution of individual Nobel laureates, excluding organisations from the dataset. The resulting pie chart provides a stark visual representation of the enduring gender gap in Nobel recognition: only 5.3% of the awards have gone to women, while 94.7% were received by men.
Script
To validate the reproducibility of the GenAI-assisted analysis, each of the eight prompts and their resulting outputs were also executed using a traditional Python-based data analysis workflow. This process is documented in the accompanying Jupyter notebook file, Nobel_data_preprocessing.ipynb, which follows the same logical steps as the GenAI prompts. The results confirmed full consistency between the two methods, showing that tasks such as data cleaning, transformation, and exploratory visualisation can now be performed accurately using natural language.
Recommendation
For tasks involving data preparation, cleaning, and exploratory visualisation, we recommend using GPT-4o, OpenAI’s multimodal model. In our experience, GPT-4o was uniquely capable of handling not only text-based transformation tasks but also generating consistent and visually informative charts directly from natural language instructions.
To enhance transparency and reproducibility—particularly for users familiar with programming—we also suggest enabling the “Always show details” feature within the interface. This allows the underlying code to be revealed alongside each GenAI-generated output, making the model’s logic easy to follow and verify. This dual visibility helps bridge the gap between no-code users and technically proficient analysts, supporting both learning and auditability.
The authors used GPT-4o [OpenAI (2025) GPT-4o (accessed on 14 April 2025), Large language model (LLM), available at: https://openai.com] to generate the output.