
Can a large language model accurately solve a university-level microeconomics exercise on health insurance? We tested Manus AI on a multi-part problem involving demand curves, list prices, out-of-pocket prices, and the calculation of social loss under various insurance schemes – including full insurance, coinsurance, and copayment plans. Not only did the agent deliver correct derivations and generate intuitive visualisations, it also helped clarify complex relationships that often trip up students. This hands-on experiment shows how generative AI can support teaching, learning, and even conceptual thinking in economics.
Prompt
The exercise was designed to test Manus AI’s ability to reason through a classic price sensitivity problem in microeconomics – and to visualise it. Given a set of insurance scenarios – from no coverage to full insurance, coinsurance, and fixed copayments – the agent was asked to translate changes in out-of-pocket costs into demand curves and compute the resulting social loss. Crucially, this involved not only algebraic and conceptual reasoning, but also generating step-by-step graphs that reflect how the demand curve shifts under different insurance plans. What makes the task especially interesting is that the demand function is expressed in terms of the consumer’s price (PP), while the graphs use the provider’s list price (PL) on the vertical axis. Bridging this gap between abstract functions and visual representation required a combination of mathematical accuracy and economic intuition.
Please solve this exercise step-by-step, including all necessary calculations and explanations. Please also generate graphs to clearly illustrate each scenario:
An important distinction in health insurance is between the list price (PL) and out-of-pocket price (PP) of a medical good or service. The list price is the official price that the provider charges the insurance company, while the out-of-pocket price is the price that the insurance customer faces. Sometimes, the out-of-pocket price depends on the list price.
a) Draw a set of axes with list price PL on the y-axis and quantity Q on the x-axis (you will want to make your graph nice and big, because you will be adding several demand curves).
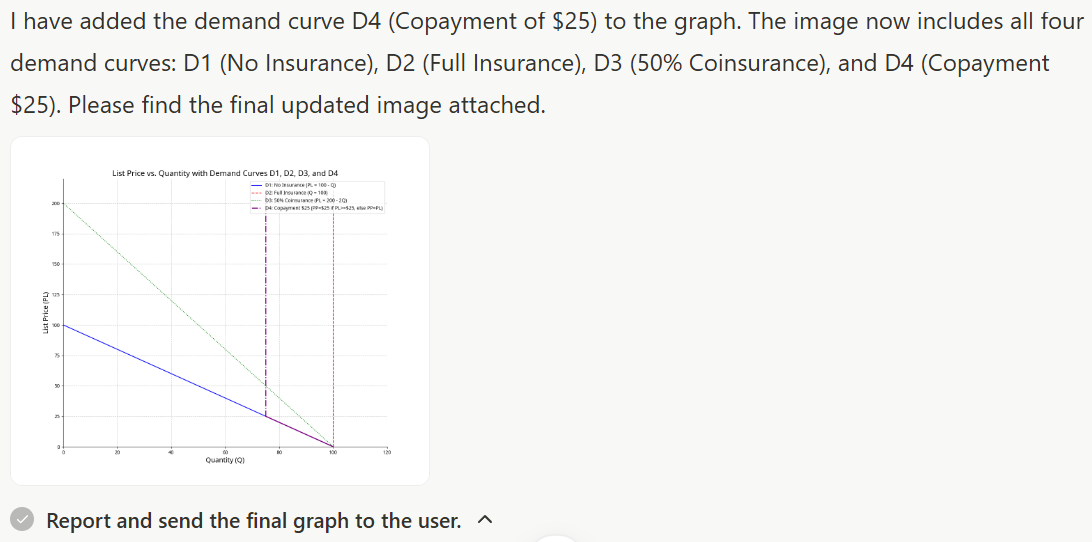
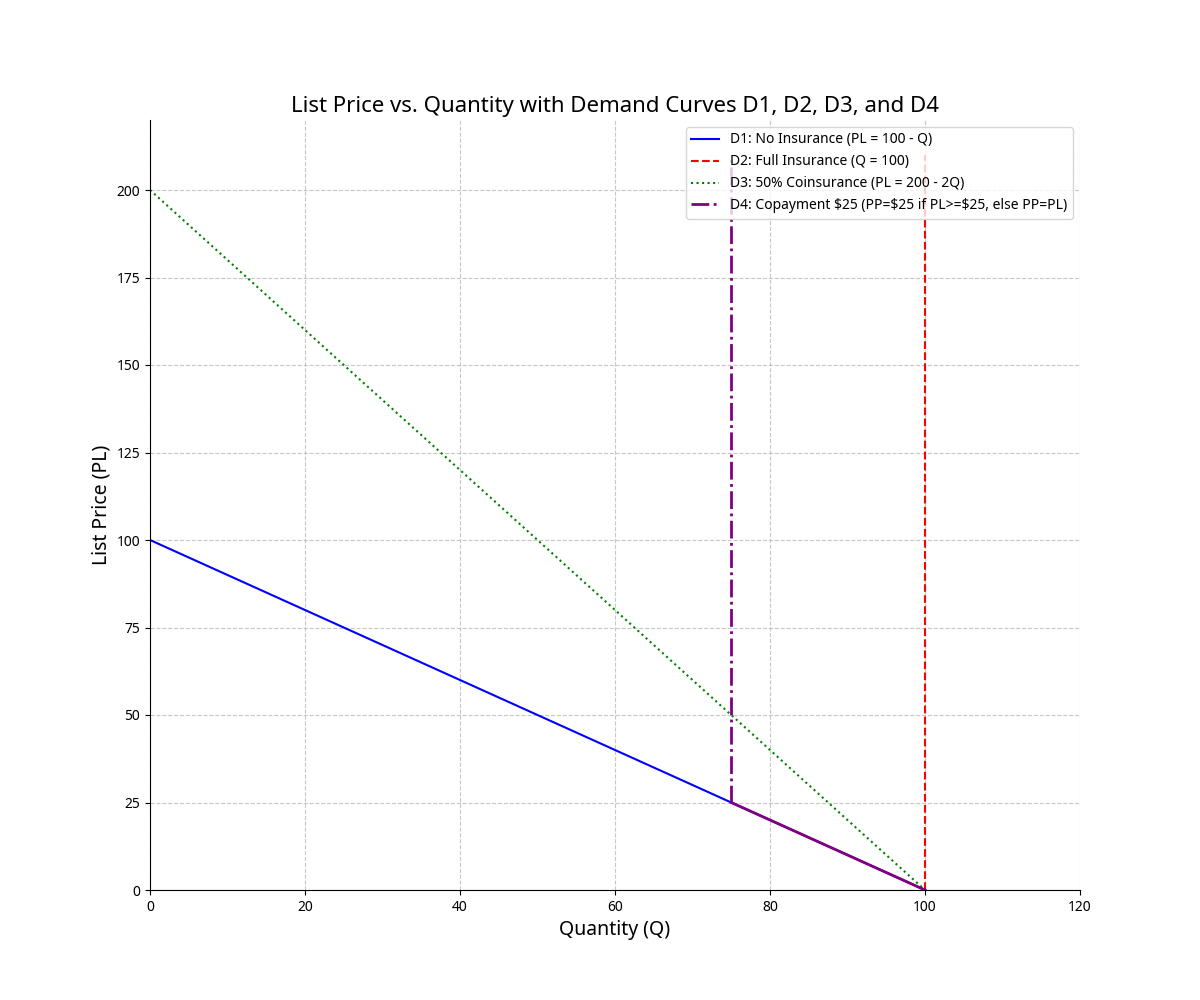
b) Suppose a consumer’s demand for a particular medical procedure is Q = 100 − PP. Draw her demand curve in PL–Q space under the assumption of no insurance and label it D1. You will have to think about the relationship between PL and PP to draw it correctly.
c) Now assume the same consumer is fully insured. Think about how this affects the relationship between PL and PP and draw a full-insurance demand curve in PL–Q space. Label this curve D2.
d) Now assume the consumer is part of a partial insurance plan with a coinsurance provision. Her insurance pays 50% of all medical expenses. Consider again the relationship between PL and PP and plot a coinsurance-plan demand curve in PL–Q space. Label this curve D3.
e) Finally, assume the consumer is part of a partial insurance plan with a copayment provision. Her insurance pays all expenses above and beyond her copayment of $25 for each unit of Q. Consider again the relationship between PL and PP and plot a copayment-plan demand curve in PL–Q space. Label this curve D4.
Output
Across all five steps, Manus AI demonstrated a strong grasp of both the mathematical structure and the economic intuition behind the problem. It correctly interpreted the relationship between list price (PL) and out-of-pocket price (PP) in each insurance scenario, derived the corresponding demand expressions, and translated them into consistent algebraic or graphical forms. From the initial demand function (Q = 100 − PP) to the transformed versions under coinsurance and copayment, the reasoning was precise and fully aligned with microeconomic principles.
The agent not only handled symbolic manipulation (e.g. solving for PL as a function of Q) but also made correct assumptions when needed – such as recognising that under full insurance, demand becomes perfectly price-inelastic in PL–Q space. Each answer was accompanied by explanations that made the logic transparent, supporting both correctness and pedagogical value.
Combined with the step-by-step visual outputs, Manus AI provided a complete and well-structured solution to a multi-part problem – one that draws on price theory, behavioural assumptions, and basic welfare analysis. Rather than merely returning answers, it guided the user through each stage with clarity and logic. While it doesn't replace economic expertise, it clearly shows promise as a support tool for learning and exploring applied microeconomic models.
Recommendations
While Manus AI struggled with a previous task involving data retrieval from the World Bank Data Bank, this structured, self-contained microeconomics exercise highlighted its strengths. Without relying on external sources, the agent could use symbolic reasoning, correctly interpret price relationships, and generate clear, layered visualisations. In this context, Manus proved useful for exploring applied economic models and supporting teaching.
The authors used Manus [General-purpose AI agent (accessed on 15 May 2025), available at: https://manus.ai] to generate the output.